We use cookies to improve your experience. By continuing, you accept our use of cookies.
Available on iOS
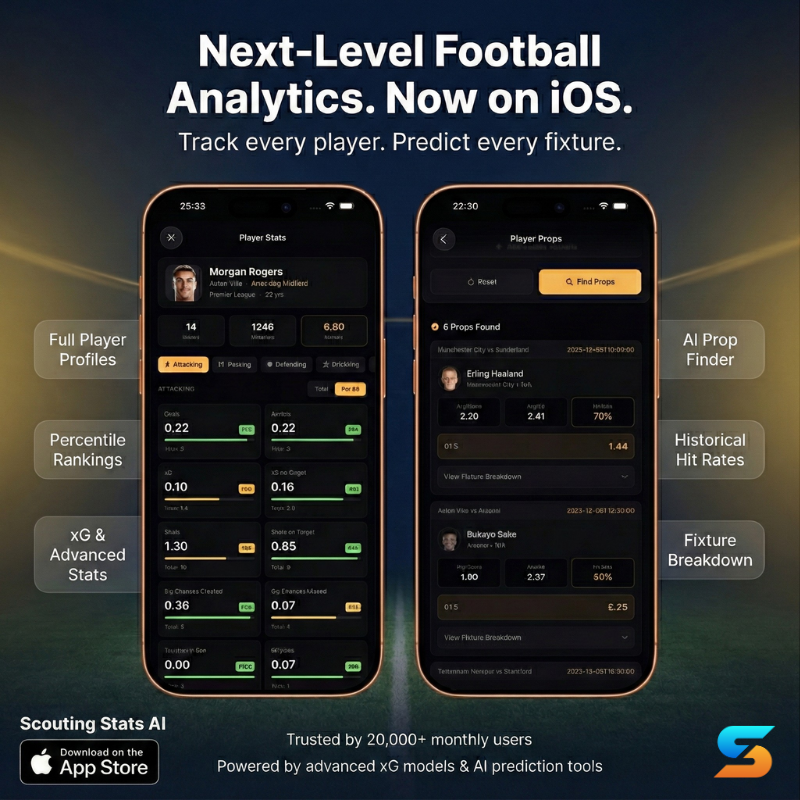
Professional scouting tools in your pocket. Access 20,000+ player profiles, advanced statistics,
team analytics, match predictions, and comprehensive performance data on the go. Full feature parity with the web platform.
Unlock Full Player Analysis
Access 15+ stats, extended lookback periods, and advanced insights
Create Report
New Report
My Reports
Pages
Add Elements
Properties
Canvas
BorderCornersFill
Layers
Configure Radar Chart
Stats to Display
0/6
Data Points
0/8
Custom Report Mode
The radar chart shows percentile values (0-100) on each axis. If your player data includes percentiles, you can load them directly. Otherwise, use the label templates or add custom categories with your own values.
Loads stats that have percentile data
Each axis shows a value from 0-100. Higher values appear further from center.
Label Templates:
Colors
Labels
Size
Background
Preview
Configure Stats Display
Select Stats
0/10
Layout
Label Style
Value Style
Background
Preview
Configure Player Header
Show Elements
Additional Info
Colors
Typography
Layout
Preview
Configure Player Info Card
Info to Display
Style
Colors
Typography
Preview
Choose Background
Premium backgrounds require a Pro subscriptionUpgrade
PNG, JPG up to 2MB
Configure Similar Players
Display Options
Element Heading
Colors
Typography
Preview
Configure Recent Form
Layout
Matches
Width
Row Spacing
Title
Text
Color
Data Fields
Row Background
Color
Colors
Text
Win
Loss
Draw
Typography
Font
Preview
Configure Position History
Position History
Shows where the player has played on the pitch. Larger markers = more games in that position. Enter games played or percentages - doesn't need to be exact!
Position Data
GK
Defense
Midfield
Attack
Total Games:0
Display Options
Marker Style
Size
Text Colors
Preview
Configure Scatterplot
Axis Stats
Display Options
Custom Report Mode
Create a scatterplot by adding data points manually. Use "Load Custom Player" to quickly add your player using stats from your player data.
Load Custom Player
Value Type:
Adds as highlighted focus point
Axis Labels
Data Points
0 points
Focus
Player Name
X Value
Y Value
Display Options
Size
Colors
Preview
Loading data...
Configure Stats View
Select Statistics
View Type
Columns
Background
Colors
Typography
Preview
Custom Stats View
Display Options
Minutes Played
View Type
Columns
Stats Data
Name
Category
Value
Is %
Bar Fill
Pctl / Range
Style Options
Preview
Add stats to see preview
Export Report
Pages to Export
to
Format
Edit Player Data
cm
kg
Used for per-90 calculations
Columns: Name | Value | Category | Is% | Percentile | Min | Max